
Service 04 · Business intelligence
Analytics and business intelligence for South African businesses
Business intelligence is the practice of turning the data a business already generates into reliable, up-to-date numbers its people can act on. We build the pipelines and dashboards that make it routine — for companies in Johannesburg, Cape Town, Durban and across South Africa.
Not a data shortage — a spreadsheet problem
Most businesses do not lack data. It sits in the accounting package, the CRM, the point of sale, the operations system — and once a month somebody spends days extracting it, stitching spreadsheets together and hoping no formula broke along the way. By the time the pack reaches management, the numbers are already old, and two departments are quietly arguing about whose version is right. Business intelligence replaces that ritual with pipelines that pull the data automatically and dashboards everyone trusts, so decisions are made on this morning's numbers instead of last month's.
What does business intelligence deliver?
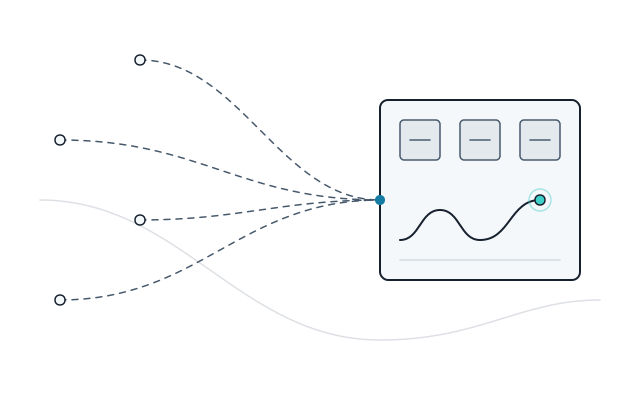
- Reporting pipelines that pull data automatically from your accounting, sales and operational systems into one place — no exports, no retyping, no broken formulas
- Dashboards for owners and managers: sales, cash flow, stock, service levels — live, on any device, not last month's version
- Predictive analytics: demand forecasting, churn-risk scoring and trend detection that turn historical data into a view of what is coming
- Decision-support systems that put the right numbers in front of the person making the call, at the moment they make it
- One version of the truth: definitions agreed once — what counts as a sale, a lead, an on-time delivery — and applied consistently everywhere
How a BI build runs
-
Agree the questions first
A dashboard is only useful if it answers the questions management actually asks. We start by writing those down — before any charts get drawn.
-
Connect the sources
We integrate your existing systems so the data flows automatically, with checks that flag gaps and anomalies instead of hiding them.
-
Ship, tune, extend
The first dashboard goes live early, gets refined against real use, and only then do we extend to forecasting and deeper analytics — value first, sophistication second.
Where does business intelligence fit?
A retailer can forecast demand ahead of the festive season instead of guessing at stock levels. A Gauteng services group could consolidate five branches' reporting into a single live dashboard. A finance team can reclaim the days each month it spends stitching spreadsheets together — and management gets its numbers sooner. A logistics operation can watch service levels move during the day, not discover the dip in next month's pack.
Common questions
What is the difference between reporting and business intelligence?
Reporting tells you what happened; business intelligence makes sure the numbers arrive by themselves, agree with each other, and increasingly tell you what is likely to happen next. A monthly pack compiled by hand is reporting. A live dashboard fed automatically from your systems, with a demand forecast beside the sales line, is business intelligence.
Which systems can feed a dashboard?
Almost anything your business already runs: accounting packages, CRMs, point-of-sale and e-commerce platforms, operational databases and even well-structured spreadsheets. If the data exists somewhere digital, a pipeline can usually fetch it — and the strategy session is where we map exactly what you have.
Related services: systems integration, AI consulting and workflow automation — or see all services.
Which number do you wish you could see right now?
That question is where every good BI project starts. Bring it to a free 30-minute strategy session and we will map what it would take to put that number on your screen every morning.